Slightly warmer and drier than average with some parts of Cumbria notably drier 'Beasts from the East' and summer droughts and heatwaves.
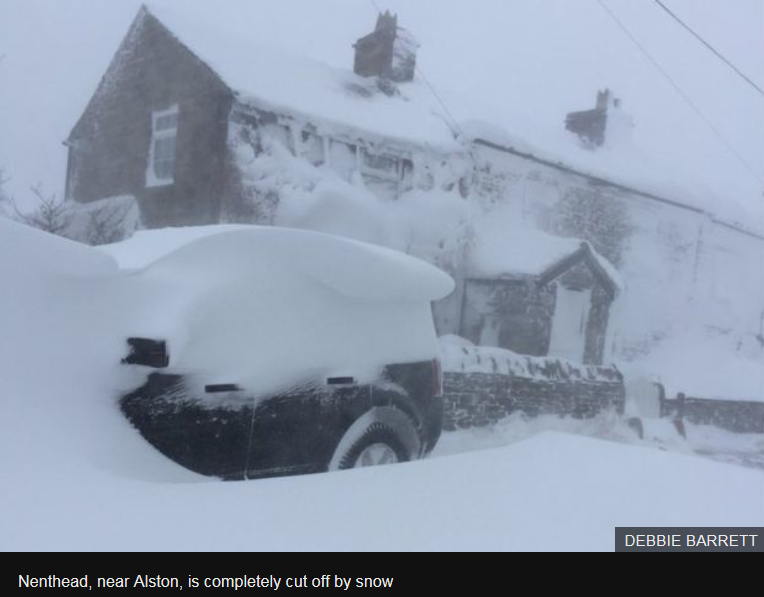
Apart for farmers and gardeners, I'm sure that the year's highlight will have been the 'Beast from the East' that hit us late in February and into early March. This was a true experience of Siberian weather. A succession of very cold days with deep snow that then drifted heavily on a raw easterly wind caused much disruption to services, travel and loss of stock to farmers.
Several villages in east Cumbria still remained cut-off on the 5th March and reported (level) snow depths were generally in the bracket of 20-25 cms (20 cms here at Maulds Meaburn on 1st March) with the Met' Office reporting snow depths of 42 cms at Spadeadam and 95 cms on top of Great Dunn Fell. For those villages that remained cut-off after five days the RAF used a Chinook helicopter to airlift vital supplies to the villages affected.
The aircraft, carrying Royal Marines, took off from Carlisle Airport to communities around Fellside, South Stainmore and Alston and supplies included food, fuel, medicines and electrical heating appliances and came as many residents said they were "burning furniture" to keep warm.
Following on from this we then had a 'proper summer' - well almost.
Whilst June and July were hot and sunny, August despite being slightly warmer than average, was a disappointment and the reason why locally we only had our fourth warmest summer and not one that was in the top three (at least).
May had been warm and dry and whilst not immediately, this continued during June, especially during the final week which saw the year's highest temperature of 29.2°c fall on the 28th. This heat-wave coincided with a period of drought when 22 consecutive days (20th June - 11th July) had no measurable rain recorded and which resulted in the River Lyvennet running dry above Crosby Ravensworth.
Yet June had seen a 'a day of gales' on the 14th with a maximum gust of 60 Mph and then in September we had several particularly early named storms ('Helene', 'Ali' and 'Bronagh') - 'Ali' bringing winds gusting to 63 Mph and 50.8 mm of rain.
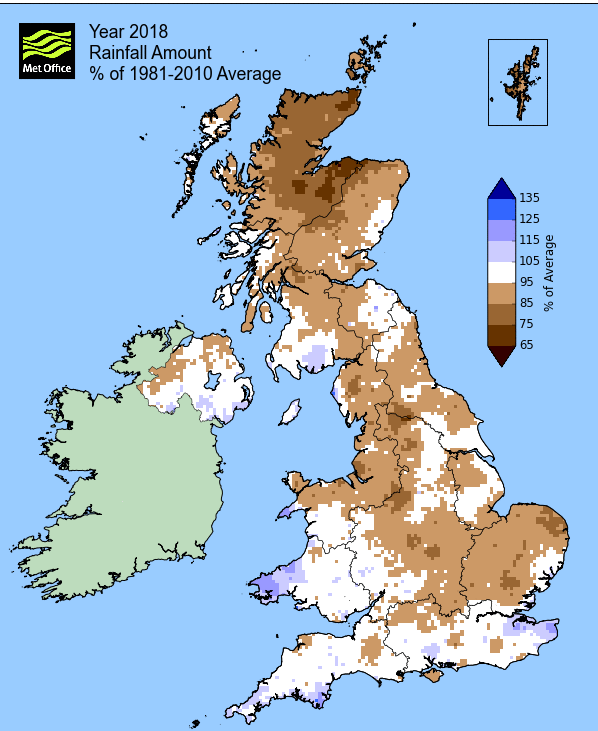
Since 2015, which included 'Desmond', we have had a run of relatively dry years with 2018 continuing the trend. Rainfall across Cumbria has typically been below average, almost across the board, notably low in a few places, but with the western coastal fringe of the county having close to and in a few places, marginally above the norm�.
And here at Maulds Meaburn it was no exception, 2018 being the third driest of the eleven now recorded. It has been marginally wetter than 2016 and marginally drier than 2017 - the last three years have all been within 24.6 mm of each other; that is less that one inch!
Fortunately this year there has been no flooding.
The closest came during 'Storm Callum on the 12-13th October (Maulds Meaburn recorded 90.9 mm over the two days) which saw disruption to travel with much surface flooding of roads, but the rivers just about stayed within their banks.
2018 has been another warm year, but without reaching the pinnacle of 2014. The cold of the 'Beast' not being able to off-set the warmth of May-July and then latterly Nov'-December'.
Provisionally this has been the 13th warmest year locally and in 2018 there was even one day when Maulds Meaburn was the warmest place in the whole of the United Kingdom!! (^^)
TEMPERATURE
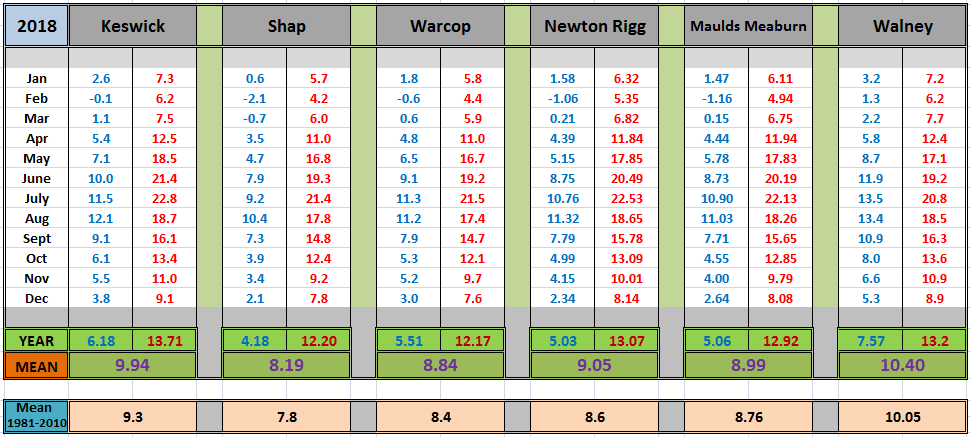
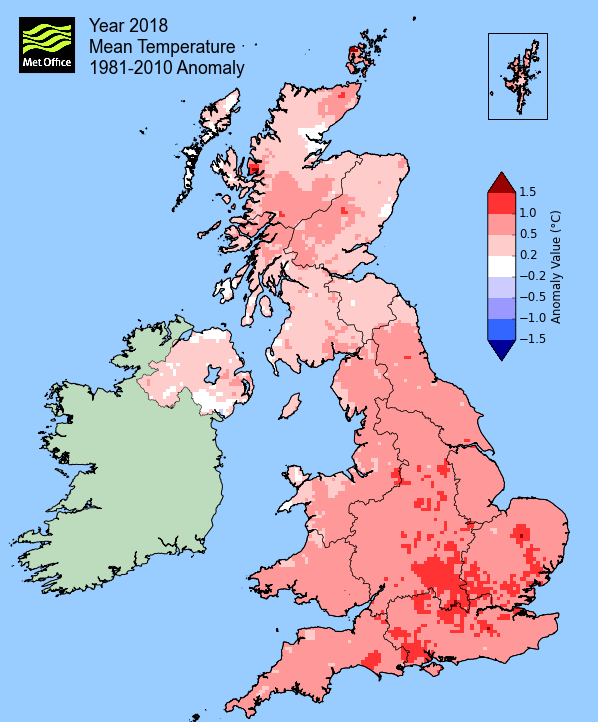
Locally all sites were warmer than average during 2018, ranging from just 0.1�c at Brampton to 0.6�c at both Spadeadam and Keswick.
This saw Keswick, for at least the fifth year in succession, once again being just that little bit more above average than everywhere else - 2018 was generally either the coldest since 2016 (Maulds Meaburn, Keswick and Shap) or the warmest year since 2014 (Newton Rigg).
One curiosity about Cumbria though is the range of temperatures - consider that in just the short distance between Newton Rigg and Keswick sees the latter with a mean temperature 0.9°c higher in 2018; however, the real diversity in Cumbria's climate is a range of more than 2°c between warmest and coldest.
This sees Walney Island with an annual mean temperature for 2018 of 10.4°c (that is what would be expected at Cambridge!), yet Shap at 8.19°c is well over 2°c colder, but colder still is Spadeadam at 7.9°c.
This saw Spadeadam, which has an annual mean temperature of 7.3�c, being a �warm spot in a cold place� and even here the mean maximum temperature in July was 21.1�c.
With a mean temperature of 9.05°c (mean minimum of 5.03°c and mean maximum of 13.07°c) at Newton Rigg, 2018 becomes the 13th warmest (of 62) in a complete series back to 1957. That 9.05°c being 0.45°c above the 1981-2010 mean.
Staying at Newton Rigg, eight months were warmer than average during the year, with three being colder and one having the same mean temperature as average (Oct') - this saw January and then all of April-August and then the last two months of the year being warmer than average, with only Feb/March and September being colder than average.
The months that finished either above or below the average by more than 1.5°c were: March, June, July and December - the month that had the largest departure from the norm', by 1.88°c, being March.
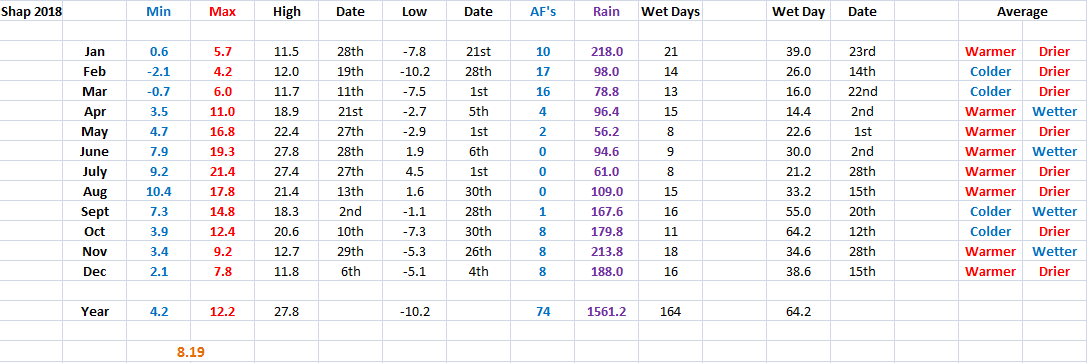
At the Met' office site at Shap 74 air frosts were recorded during 2018, its average being 74.5 and which had an annual mean temperature of 8.2°c (0.4°c above average).
Here at Maulds Meaburn a mean temperature of 8.99°c (mean minimum of 5.06°c and maximum of 12.92°c) was some 0.26°c above the average for my short period of records for (2009-2017), but which is very much in keeping with the picture throughout Cumbria.
The highest and lowest temperatures recorded at a standard site during 2018 were: a maximum of 31.2°c (29th June at Sebergham) and a minimum (excluding Great Dunn Fell) of -10.2°c (28th February and like 2017, at Shap).
Here at Maulds Meaburn it was: 29.2°c (84.6°f) 28th June and -8.0°c (17.6°f) on the 28th February.
During the 'Beast' we endured a succession of 'Ice Days' (when the temperature remains below freezing for the 24hr period), beginning with a maximum of just -1.3°c on the 28th February, continuing on for both the 1st and 2nd March.
This was the coldest and snowiest spell of weather since December 2010.
In many ways the hot summer started with the first May Bank holiday with temperatures above 20°c and which was repeated at the next Bank holiday a few weeks later.
June ticked along but included a mid month lull before the heat returned on the 24th and which then saw the five days of 25-29th all peak above 25°c. It then wasn't until 13th July that the temperature finally, briefly, dipped below 20°c.
The warmest day of the year may not have fallen in July, but it would still become the second warmest of any month in my ten years of records and it was only spoilt by spells of rain during the 27-30th.
A selection of monthly mean temperatures is shown below:
RAINFALL
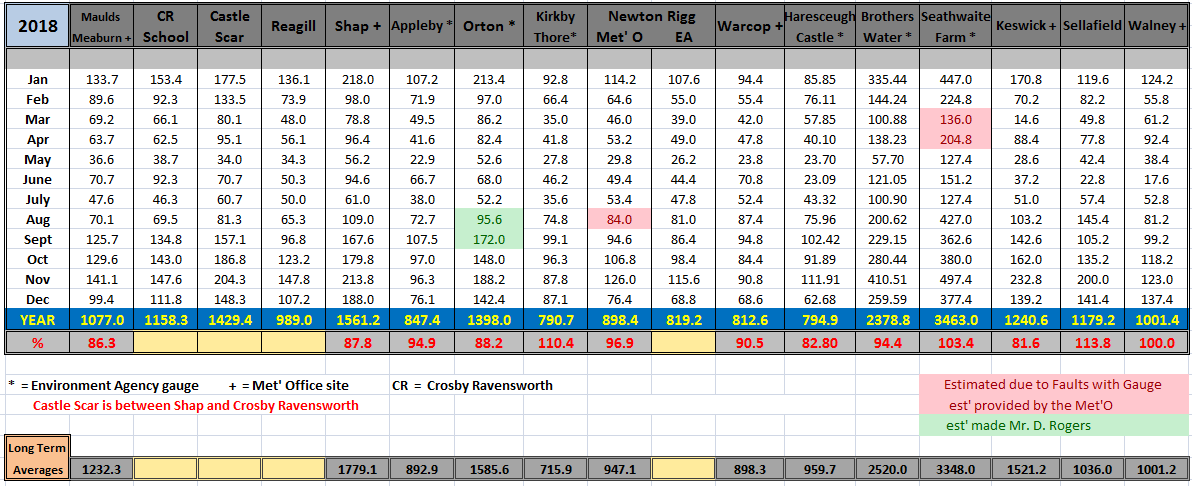
It varied from site to site as to when 2018 was the driest year since, but it was no further back than 2010 - at Newton Rigg and Shap it was 2013, at Appleby and Orton 2010 and at Maulds Meaburn it was only 2016, but the majority of Cumbria was drier than average, in the range of 80-90% of normal and it was only the coastal fringes that saw some sites finish with totals that were just above average.
Whilst some sites just sneeked in with above average rainfall, some sites were more than 15% below their average, Keswick being the driest with just 81.6% of its average.
At Newton Rigg the rainfall record commenced in 1900 (3yrs data is incomplete) and average rainfall for 1900-2017 was 927.4 mm. The final total of 898.4 mm (96.9%) makes 2018 the 46th driest (70th wettest) in its records.
Yet despite it being a drier than average year just the six months were drier than average! Five were wetter and one (Sept') was on average - the five that were drier being: February, March, May-July and December. But again to show the vagaries, at Shap it was slightly different; eight months were drier than average here and additionally included: January, August and October - but then June was wetter!
The day during the year with the highest 24Hr total was 10th September when 104.2 mm (4.1 in.) was recorded at Honister.
A selection of local rainfall totals from various standard sites is shown below:
**�Data kindly provided by the Hydrometry and Telemetry team of the Environment Agency (Penrith)�.
In an even longer series of 162 years, back to 1857, rainfall of 847.4 mm at Appleby makes 2018 the 63rd driest year (100th wettest) in that time.
Since 1857 average annual rainfall in Appleby is 893.2 mm (1981-2010 average of 892.5 mm) and the 2018 total represents one of the higher percentages in the county at 94.9% of average.
An even longer record is held for Seathwaite, back to 1845 (this being the 174th year). With 3422.2 mm of rain (134.73 in.)(102%), 2018 has been the driest year since 2013 and 97 years have been drier and 76 have been wetter.
Figures that are odds with Appleby � but this is Cumbria and from the wettest location to one of the driest.
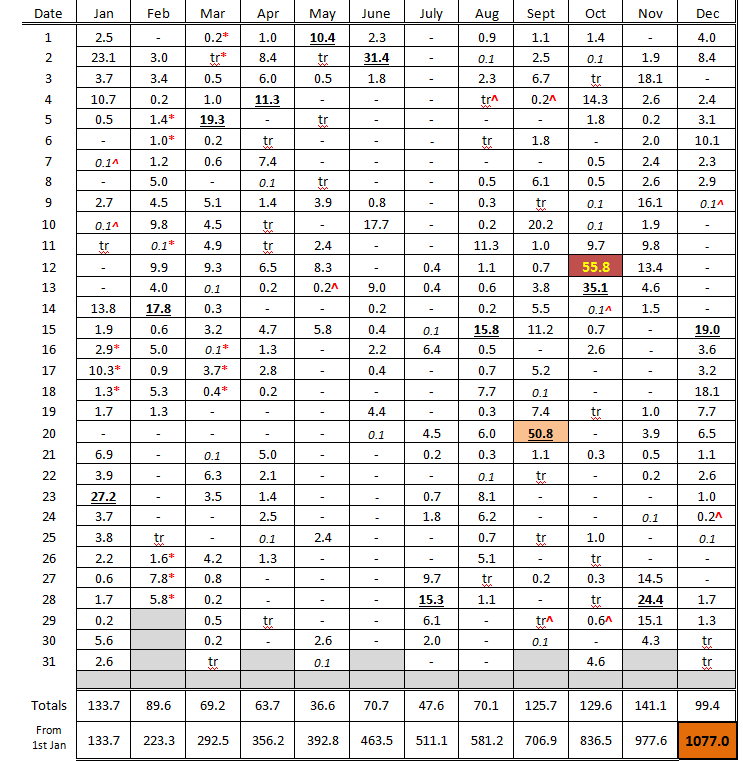
Rainfall at Maulds Meaburn was 1077.0 mm (42.4 inch) with rain recorded on 205 days (13.1 below than average) of which 153 were 'wet days' (days of 1.0 mm=>)(10.5 below average).
This makes 2018 the third driest in my eleven complete years of records.
An inch or more of rain falling within 24hrs was recorded on five days, two of them falling on consecutive days in October, which included the year's wettest day, 55.8 mm on the 12th and which is 5.18% of the annual total.
For the second time in my records 50 mm or more of rain was recorded on two separate days (the other occasion was last year) with 50.8 mm falling on the 20th September (that is 50 mm due to completely different rainfall events - The 'Desmond' event of 2015 saw 50mm+ on consecutive days, but was all part of the same weather system). This curiously means that 10% of the year's total rainfall actually fell on just two days - just like last year!
This is the fourth full year that I have had a rain gauge in Crosby Ravensworth (CR), just 0.7 miles from my own gauge in Maulds Meaburn (MM) and the monthly differences between the two remain relatively small.
This year has been slightly different in that MM has been wetter in more months, (March, April, July and August) but which still follows the trends of the previous years in that MM is wetter in the year's drier months and/or when the dominant winds were not from the SW.
The annual total of 1158.3 mm (45.6") at CR is 107.5% of that at MM and once again compares quite favourably to the previous three years (114.2% in 2015 - 110% in 2016+17) which is beginning (and continuing) to show that in a relatively dry year we can expect CR to have no greater than 10% more rainfall than MM.
This is the third year of a gauge at CastleHowe Scar (between CR and Shap) and the final total of 1429.4 mm shows a fine correlation to that at MM and CR as the rainfall increases towards Shap.
In those three years the percentage diffrence between Castlehowe Scar and Maulds Meaburn have been:
2016 = 115.3% 2017 = 132.0% 2018 = 132.7%.
In comparison to totals for 2017+18, the 2016 total now look a little low?
THE SEASONS
Of the seasons, especially winter and spring, there was much cancelling out of cold and warm months to finish with something approaching average, but as for rainfall, only the autumn finished wetter than average.
The spring finished much drier than average, Newton Rigg only having 70% of its average total and the theme of drier than average seasons was only broken by the autumn which was wet throughout.
As for temperature, the Winter (2017-18) was just below average and the spring cancelled the cold and warm out and finished on average. The warmth of the year then really kicked in and both the summer and autumn finished warmer than average, although only marginally in case of the autumn.
^^Highs and Lows
Occasionally sites in Cumbria will record the highest/lowest temperature, be the wettest or windiest place on any one individual day for the whole of the UK - this year's highlights, starting with the occasion when Maulds Meaburn was the warmest are:
Maulds Meaburn was the equal warmest site (with Levens, South Cumbria) in the UK on the 30th March with a maximum temperature of 10.6°c - the day itself was dry, but cloudy.
3rd January - Highest Gust - 100 Mph - Great Dunn Fell
20th February - Most Sunshine - 8.9 Hrs - Bewcastle
18th March - Highest Gust - 112 Mph - Great Dunn Fell
9th August - Most Sunshine - 13.6 Hrs - South Stainmore
The following is the monthly breakdown of the weather at Shap during 2018.
OTHER - Maulds Meaburn data:
� A Mean Minimum of 5.06°c - Mean Maximum of 12.92°c
� During 2018 snow lay on the ground* on 16 days (3.6 above average) and was seen to fall on 29 (inc' sleet) with hail falling on 5 days.
� Fog* was recorded on 3 days with thunder heard on 8 days.
� Mean cloud* cover was 77.0% with 126 days having a 100% cover* and 10 days being totally clear.
� Mean air pressure* was 1013.3 Mb - Lowest pressure was 971.7 Mb (3rd Jan') and the highest was 1038.9 Mb (25th Sept' + 22nd Oct').
� Mean wind speed* was 6.79 Mph - the highest gust = 63 Mph (24th Jan' + 19th Sept') - the windiest day with a mean speed of 21.2 Mph was the 24th Jan'.
� Gales (a 10 min' mean wind speed of 39 Mph) were recorded on two days.
� We had 66 air frosts (6.6 above average) - 115 ground frosts (2.5 below average) - with 56 days attaining 20°c+ (25.7 above average) of which 9 went on to attain 25°c.
� There were 3 'Ice days' when the temperature remained below freezing all day.
� The 30 cm soil temperature had a mean of 10.4°c with a low of 2.4°c (5th Mar') and a high of 18.6°c (29th June to 2nd July and 5th + 28th July).
� The 100 cm soil temperature had a mean of 10.3°c with a low of 4.5°c (6th Mar') and a high of 15.7°c (29th to 31st July).
� * Refers to 0900 GMT � the hour of observations.
� Met' office data is still provisional for August onwards.
� THANKS:- There are several people whom I would like to thank for their help, support and assistance over the past year: For the supplying of data: to Susan Sandelands and Martin Wilson of the Hydrometry and Telemetry team at the Environment Agency (superbly efficient). And then to a my deputy observers who stand in for me when required, Alan and especially Sarah.
        ------------------------------------------------------------------------------------------------------------------------------

                                  * 2018                 TEMP'     8.99°c         --          RAIN    1077.0 mm
                                  * 2017                 TEMP'     9.14°c         --          RAIN    1096.7 mm
                                  * 2016                 TEMP'     8.89°c         --          RAIN    1072.1 mm
                                  * 2015                 TEMP'     8.75°c         --          RAIN    1663.8 mm
                                  * 2014                 TEMP'     9.58°c         --          RAIN    1343.8 mm
                                  * 2013                 TEMP'     8.49°c         --          RAIN    1232.1 mm
                                  * 2012                 TEMP'     8.26°c         --          RAIN    1415.9 mm
                                  * 2011                 TEMP'     9.17°c         --          RAIN    1305.4 mm
                                  * 2010                 TEMP'     7.42°c         --          RAIN     702.9 mm
                                  * 2009                 TEMP'     8.86°c         --          RAIN    1264.5 mm
                                  * 2008                 TEMP'                    --          RAIN    1381.3 mm
JANUARY 2010
FEBRUARY 2010
MARCH 2010
APRIL 2010
MAY 2010
JUNE 2010
JULY 2010
AUGUST 2010
SEPTEMBER 2010
OCTOBER 2010
NOVEMBER 2010
DECEMBER 2010
JANUARY 2011
FEBRUARY 2011
MARCH 2011
APRIL 2011
MAY 2011
JUNE 2011
JULY 2011
AUGUST 2011
SEPTEMBER 2011
OCTOBER 2011
NOVEMBER 2011
DECEMBER 2011
JANUARY 2012
FEBRUARY 2012
MARCH 2012
APRIL 2012
MAY 2012
JUNE 2012
JULY 2012
AUGUST 2012
SEPTEMBER 2012
OCTOBER 2012
NOVEMBER 2012
DECEMBER 2012
SUMMER 2012
REVIEW OF 2012
JANUARY 2013
FEBRUARY 2013
MARCH 2013
APRIL 2013
MAY 2013
JUNE 2013
JULY 2013
AUGUST 2013
SEPTEMBER 2013
OCTOBER 2013
NOVEMBER 2013
DECEMBER 2013
REVIEW OF 2013
JANUARY 2014
FEBRUARY 2014
MARCH 2014
APRIL 2014
MAY 2014
JUNE 2014
JULY 2014
AUGUST 2014
SEPTEMBER 2014
OCTOBER 2014
NOVEMBER 2014
DECEMBER 2014
WINTER 2014
REVIEW OF 2014
JANUARY 2015
FEBRUARY 2015
MARCH 2015
APRIL 2015
MAY 2015
JUNE 2015
JULY 2015
AUGUST 2015
SEPTEMBER 2015
OCTOBER 2015
NOVEMBER 2015
DECEMBER 2015
REVIEW OF 2015
JANUARY 2016
FEBRUARY 2016
MARCH 2016
APRIL 2016
MAY 2016
JUNE 2016
JULY 2016
AUGUST 2016
SEPTEMBER 2016
OCTOBER 2016
NOVEMBER 2016
DECEMBER 2016
REVIEW OF 2016
JANUARY 2017
FEBRUARY 2017
MARCH 2017
APRIL 2017
MAY 2017
JUNE 2017
JULY 2017
AUGUST 2017
SEPTEMBER 2017
OCTOBER 2017
NOVEMBER 2017
DECEMBER 2017
REVIEW OF 2017
JANUARY 2018
FEBRUARY 2018
MARCH 2018
APRIL 2018
MAY 2018
JUNE 2018
JULY 2018
AUGUST 2018
SEPTEMBER 2018
OCTOBER 2018
NOVEMBER 2018
DECEMBER 2018
OTHER ARTICLES
The Oldest Inhabitant
An Inch Of Scotch Mist
But it's meant to be Summer (Summer 2017)
© Darren Rogers 2010-19
Want to comment on this site? email